Understanding bettor behavior by entry round gives marketers a powerful lens into retention patterns, drop-off points, and high-intent engagement windows during March Madness. Rather than treating all bettors the same, this analysis allows sportsbook marketers to segment audiences based on when they first wagered—and tailor campaigns, offers, and messaging to extend activity throughout the tournament. It’s a blueprint for increasing player lifetime value during one of the year’s most important betting events.
Stay in touch
Be the first to know all about the latest Marketing tips & tricks, Industry special insights and more
The Big Picture
This report analyzes bettor behavior during the 2024 March Madness tournament based on when participants first placed a wager. Rather than examining overall betting volume per round, the analysis tracks how bettors who engaged in a particular round — referred to here as “Rounds of Bettors” — continued (or did not continue) placing bets in subsequent rounds or non-game-day windows.
This approach helps sportsbooks identify patterns of retention, understand where drop-offs occur, and determine which groups of bettors are more likely to stay active throughout the tournament.
Bets and Betting Volume by Round of Bettors
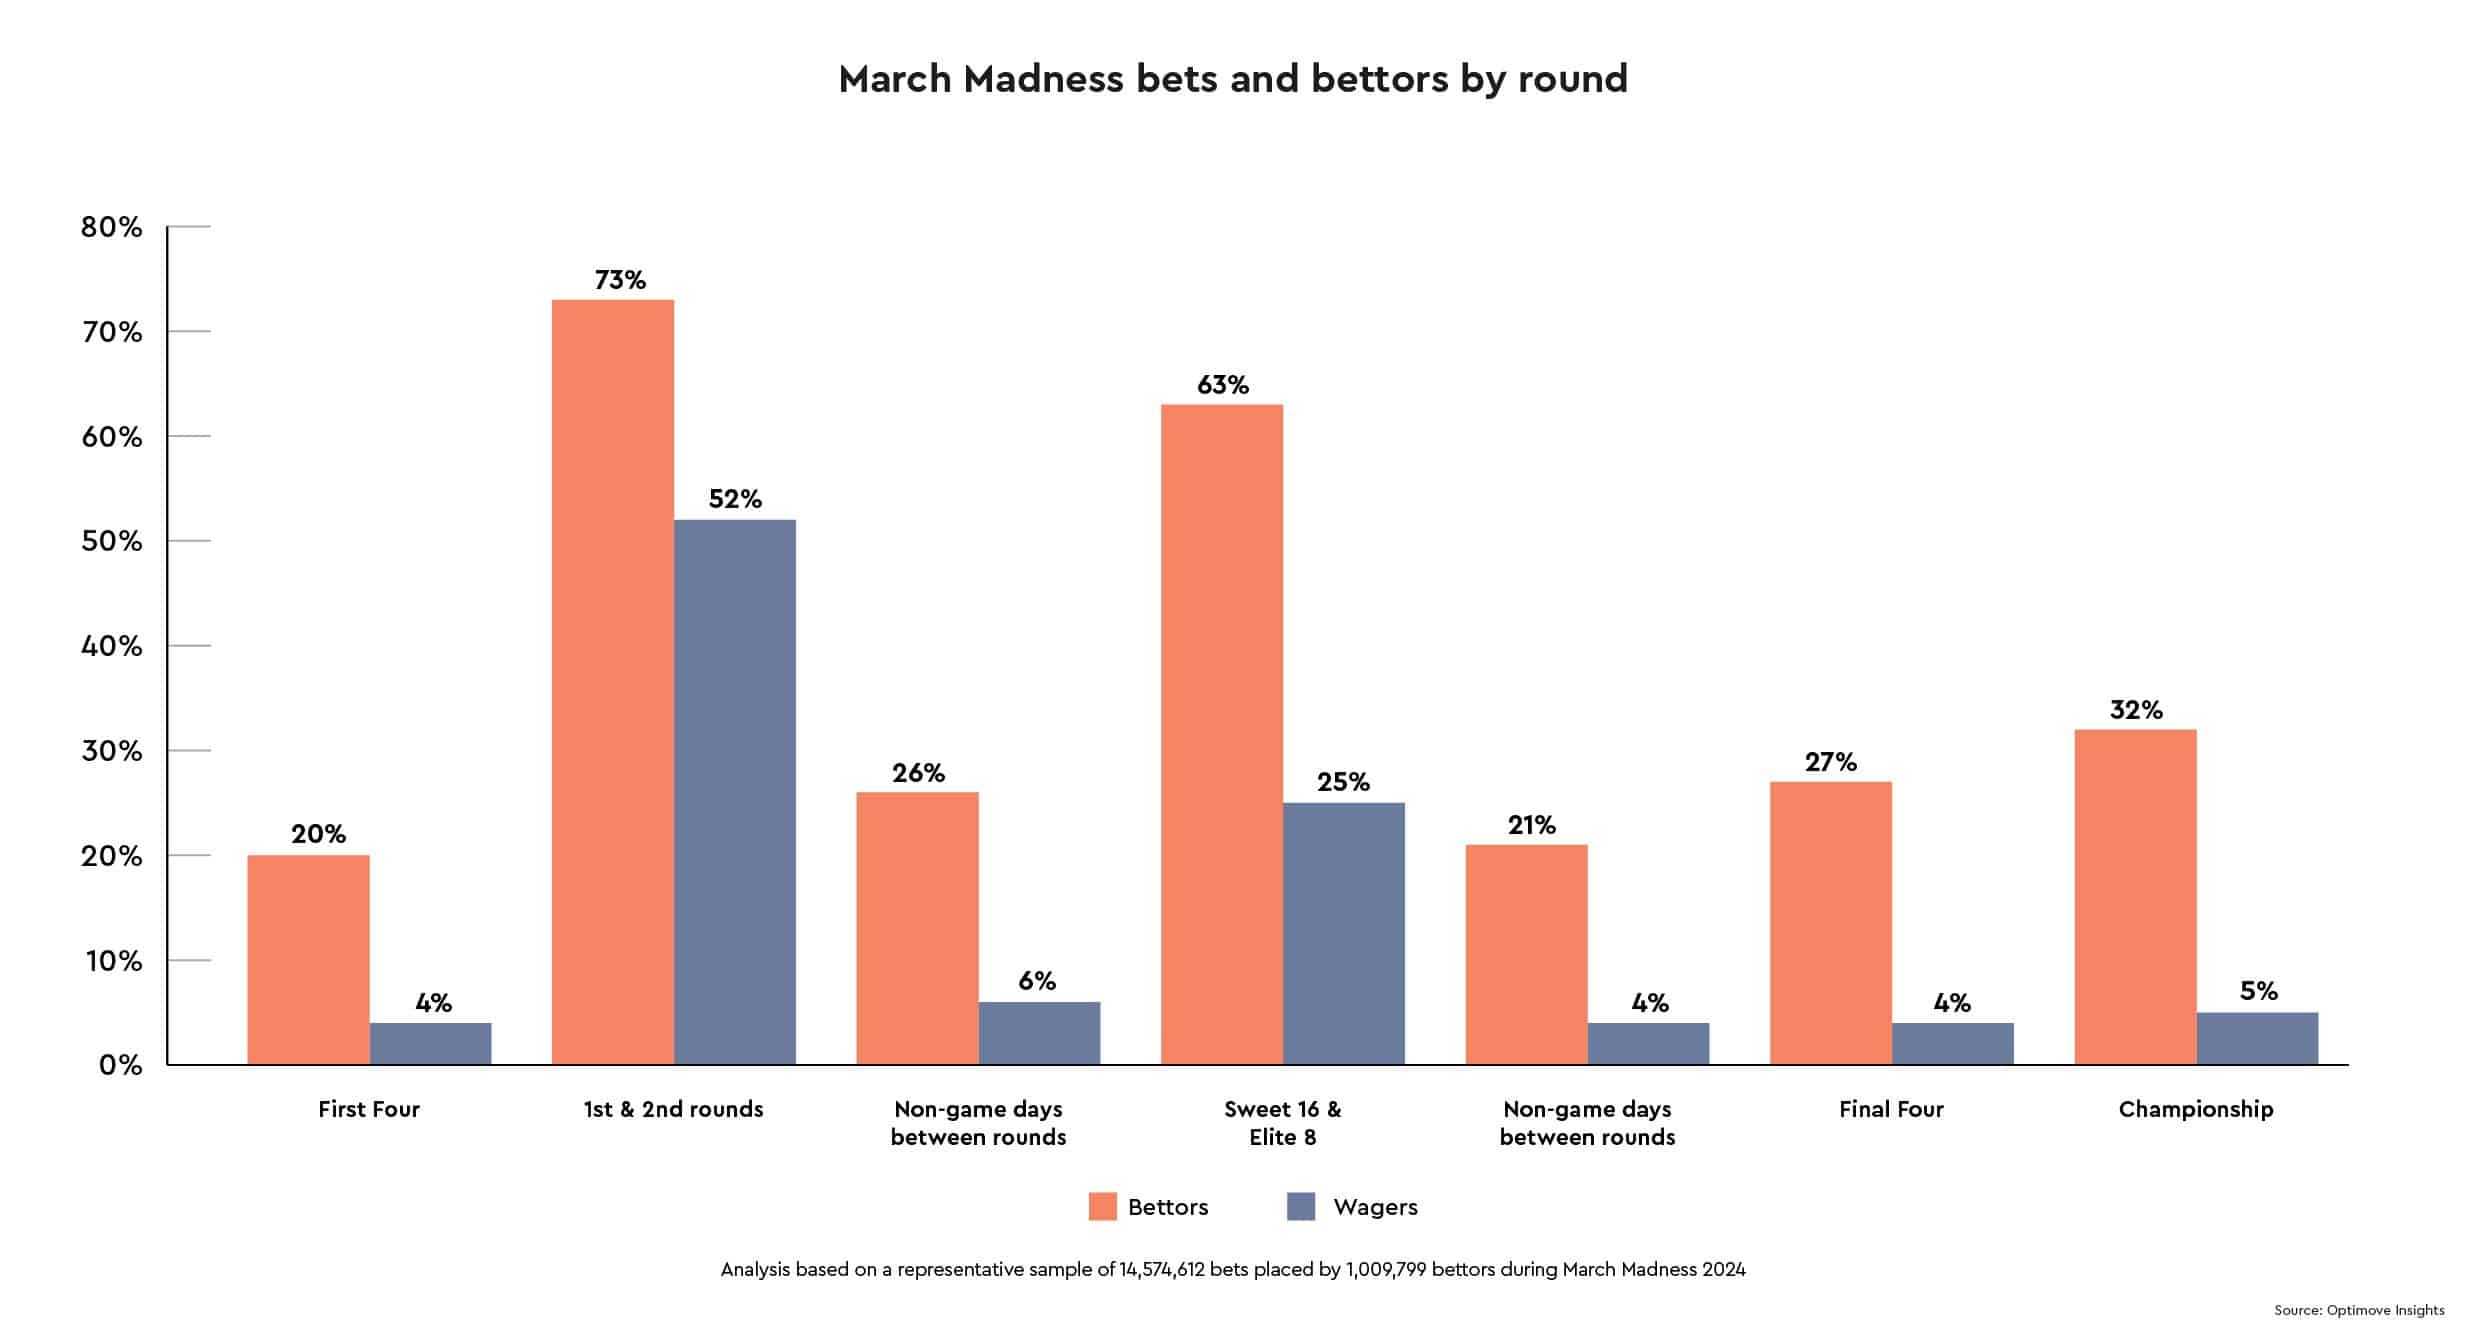
The chart below shows the percent of bettors who wagered by round. In this chart
The First Four included 4% of the total wagers made by 20% of the bettors
The 1st and 2nd Round included 52% of the total wagers made by 73% of the bettors
Non-game days between the 1st/2nd Round and the Sweet 16 included 6% of the total wagers made by 26% of the bettors
The Sweet 16/Elite 8 included 25% of the total wagers made by 63% of the bettors
The Non-game Days before the Final Four included 4% of the total wagers made by 21% of the bettors
During the Final Four 4% of the total wagers made by 27% of the bettors
The Championship Game included 5% of the total wagers made by 32% of the bettors
Analysis: Bets and Betting Volume by Round of Bettors
1. Early Rounds Drive the Most Engagement
73% of bettorsparticipated in the 1st and 2nd Round, accounting for 52% of all bets—making this the clear peak in both participation and volume.
The Sweet 16/Elite 8 round also performed strongly, with 63% of bettors contributing 25% of total bets.
Insight: The early-to-mid tournament phase is the sweet spot for both breadth (number of bettors) and depth (betting volume). It’s where excitement, bracket participation, and team loyalty are all still high.
2. Drop-Off on Non-Game Days and in Later Rounds
On non-game days, only 4-6% of bets were placed, despite 21–26% of bettors still being active. This suggests lower activity per person and fewer opportunities to bet.
The Final Four and Championship Game each drew only 4–5% of total bets, even though 27–32% of bettors engaged.
Insight: Engagement declines late in the tournament—not necessarily because bettors disappear, but because they place fewer bets per person. This may be due to:
Fewer games being played
Elimination of favorite teams
Less compelling odds or outcomes
Higher perceived risk
3. Bettor Retention vs. Volume
The number of bettors in the Championship Game (32%) was higher than in the Final Four (27%), but the bet volume remained low (5%), suggesting casual or smaller-value bets.
Insight: Some players return for the final moment, but don’t wager heavily. This might be an opportunity for targeted reactivation campaigns, or “last shot” offers.
Implications for Sportsbooks
Prioritize acquisition and promotional spend early—especially for the First Four through the Sweet 16/Elite 8—when players are most active and bet volume is highest.
Use non-game days to deliver retention content, educational materials, or lighter engagement (e.g., bracket challenges, bonus drops).
For later rounds, consider reactivation campaigns or special offers tailored to bettors whose teams are still in play or who have decreased activity.
Recognize that bettor engagement does not equal bet volume—a large active base doesn’t always translate to proportional wagering.
Betting Trends by Round of Bettors
1. First Four Bettors
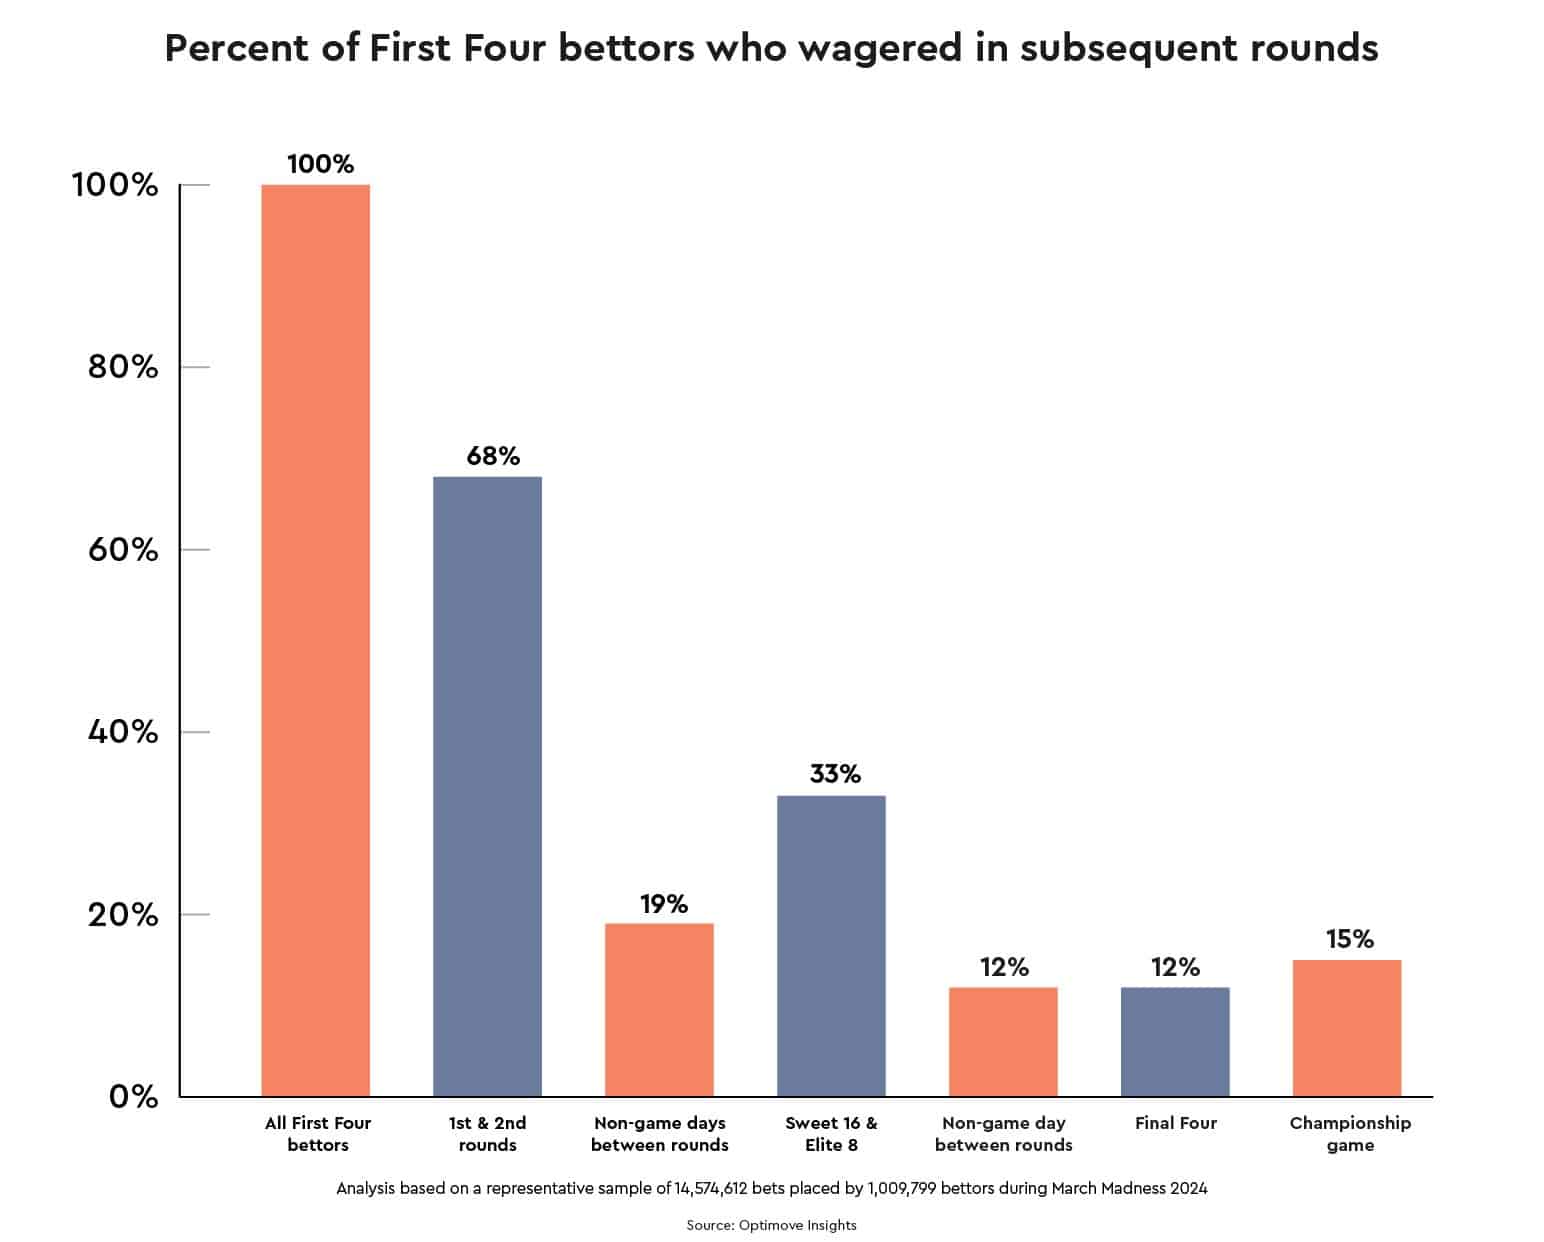
Among bettors who placed a wager during the First Four:
68% also bet during the 1st and 2nd Round
19% bet during the non-game days between the 1st/2nd Round and the Sweet 16
33% bet on the Sweet 16/Elite 8
12% bet during the non-game days before the Final Four
12% bet on the Final Four
15% bet on the Championship Game
Implication: Bettors who begin early in the tournament show a high initial engagement but drop off steeply in later rounds. This group may be driven by early excitement or emotional connection to teams.
2. 1st and 2nd Round Bettors
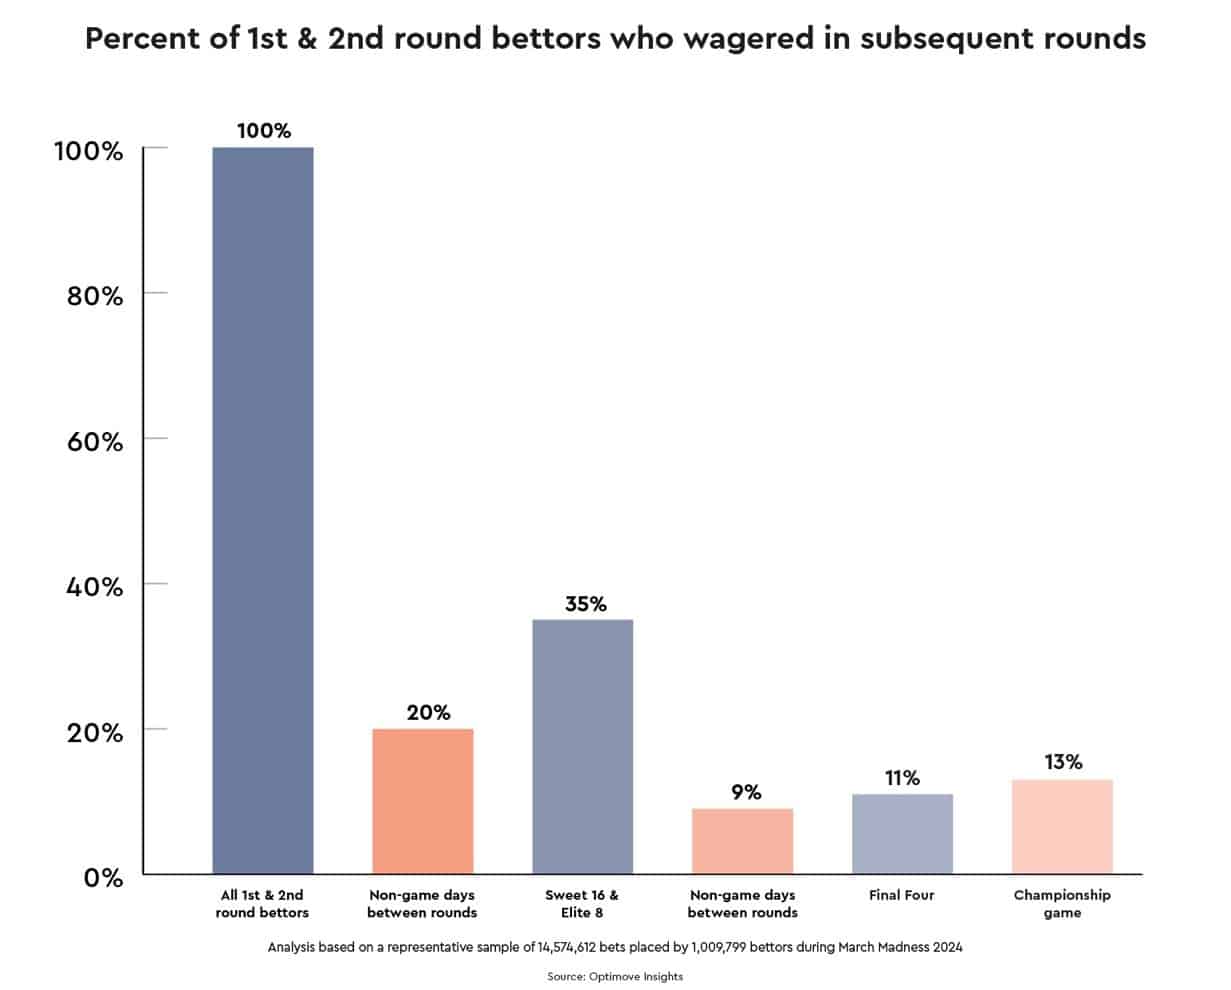
Among bettors who placed a wager during the 1st and 2nd Round:
20% bet during the non-game days before the Sweet 16
35% bet on the Sweet 16/Elite 8
9% bet during the non-game days before the Final Four
11% bet on the Final Four
13% bet on the Championship Game
Implication: These bettors show slightly stronger continuation than First Four bettors but still show diminishing engagement as the tournament progresses.
3. Bettors on Non-Game Days Between the 1st/2nd Round and the Sweet 16
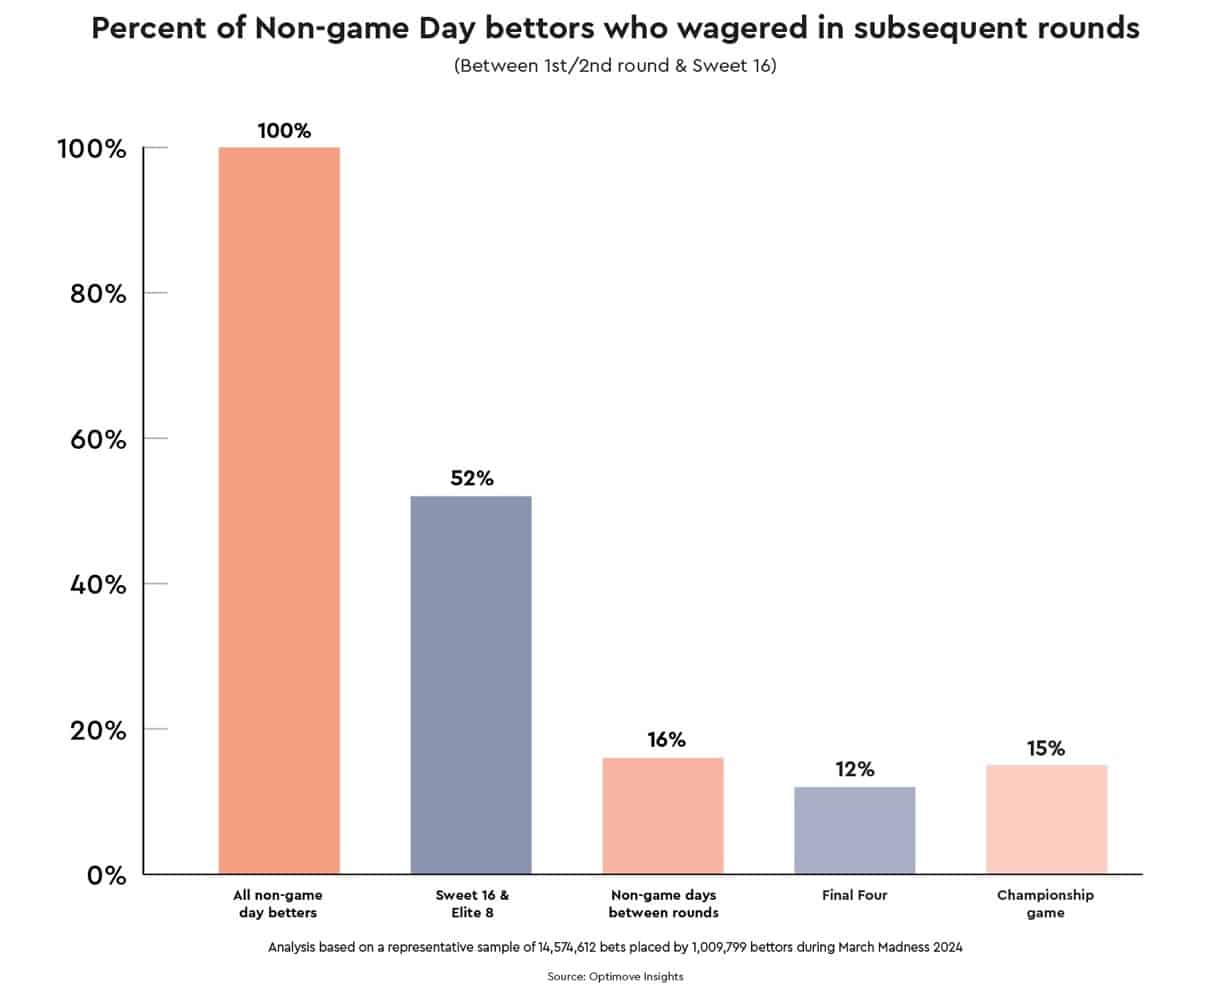
Among bettors active on non-game days between the 1st/2nd Round and Sweet 16/Elite 8:
52% bet on the Sweet 16/Elite 8
16% bet during the non-game days before the Final Four
12% bet on the Final Four
15% bet on the Championship Game
Implication: Bettors who place wagers between games tend to remain active in later rounds. This group may represent higher intent or more invested players.
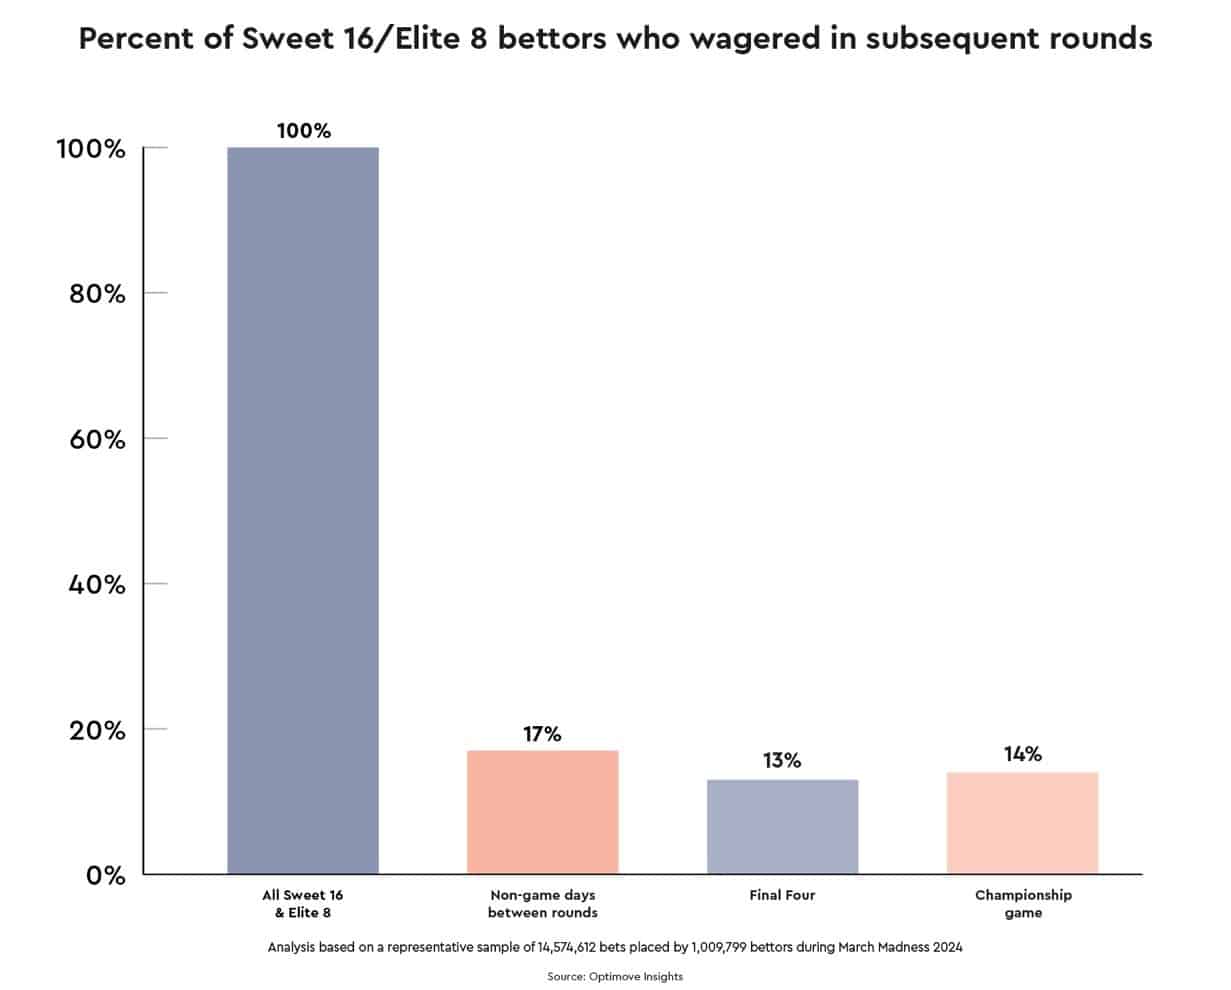
4. Sweet 16/Elite 8 Bettors
Among bettors who placed a wager during the Sweet 16/Elite 8:
17% bet during the non-game days before the Final Four
13% bet on the Final Four
14% bet on the Championship Game
Implication: Even bettors active in the middle-to-late stage of the tournament do not automatically continue through to the final games without re-engagement.
The Guide to Control Groups in Marketing
Optimize your marketing efforts with our guide and gain access to a free uplift calculator.
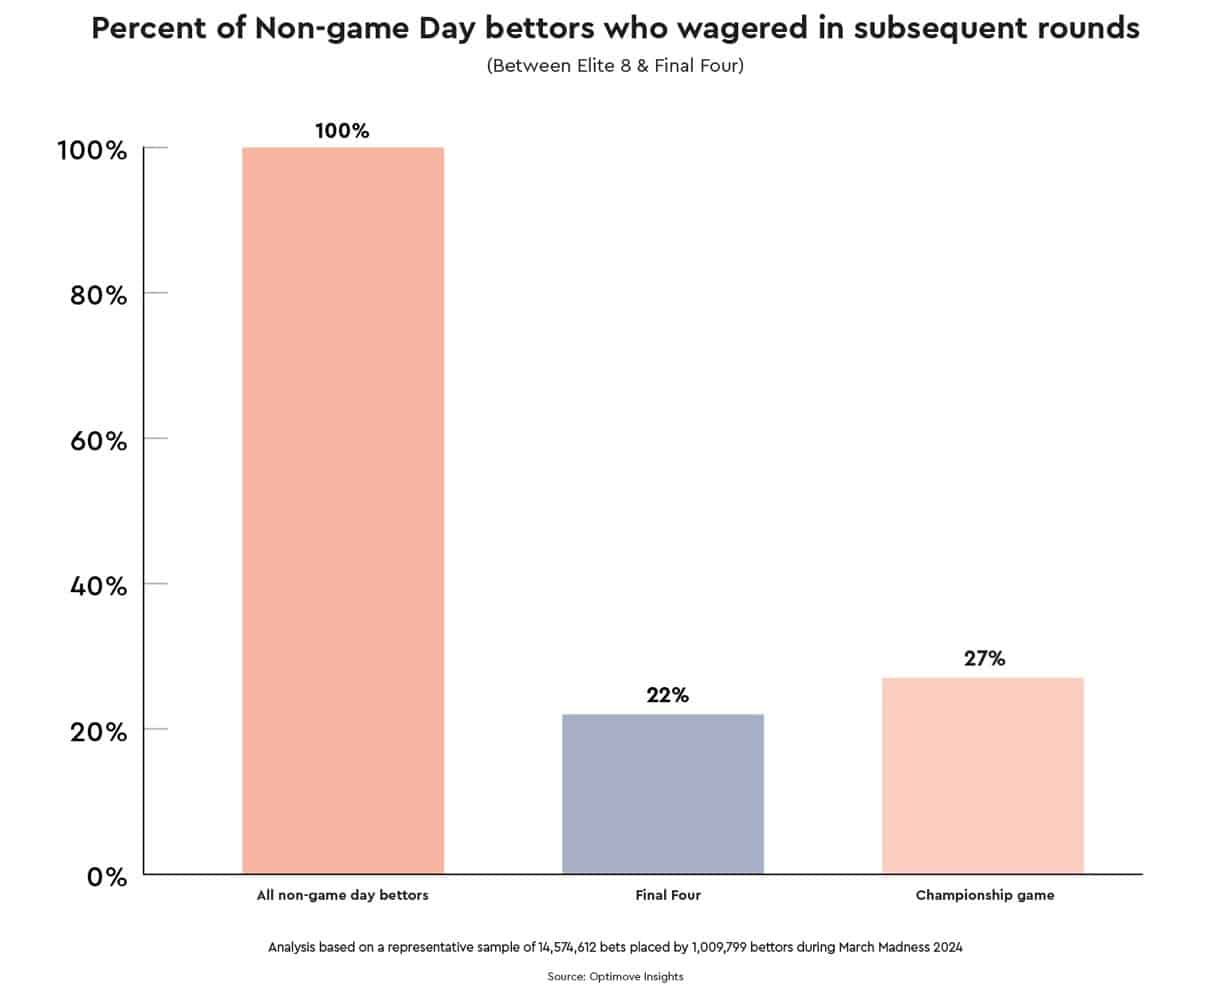
5. Bettors on Non-Game Days Between the Sweet 16/Elite 8 and the Final Four
Among bettors active during non-game days before the Final Four:
22% bet on the Final Four
27% bet on the Championship Game
Implication: This small group shows relatively high conversion to final-stage betting. Non-game-day activity continues to be a strong indicator of long-term engagement.
How to treat every campaign like a marketing experiment
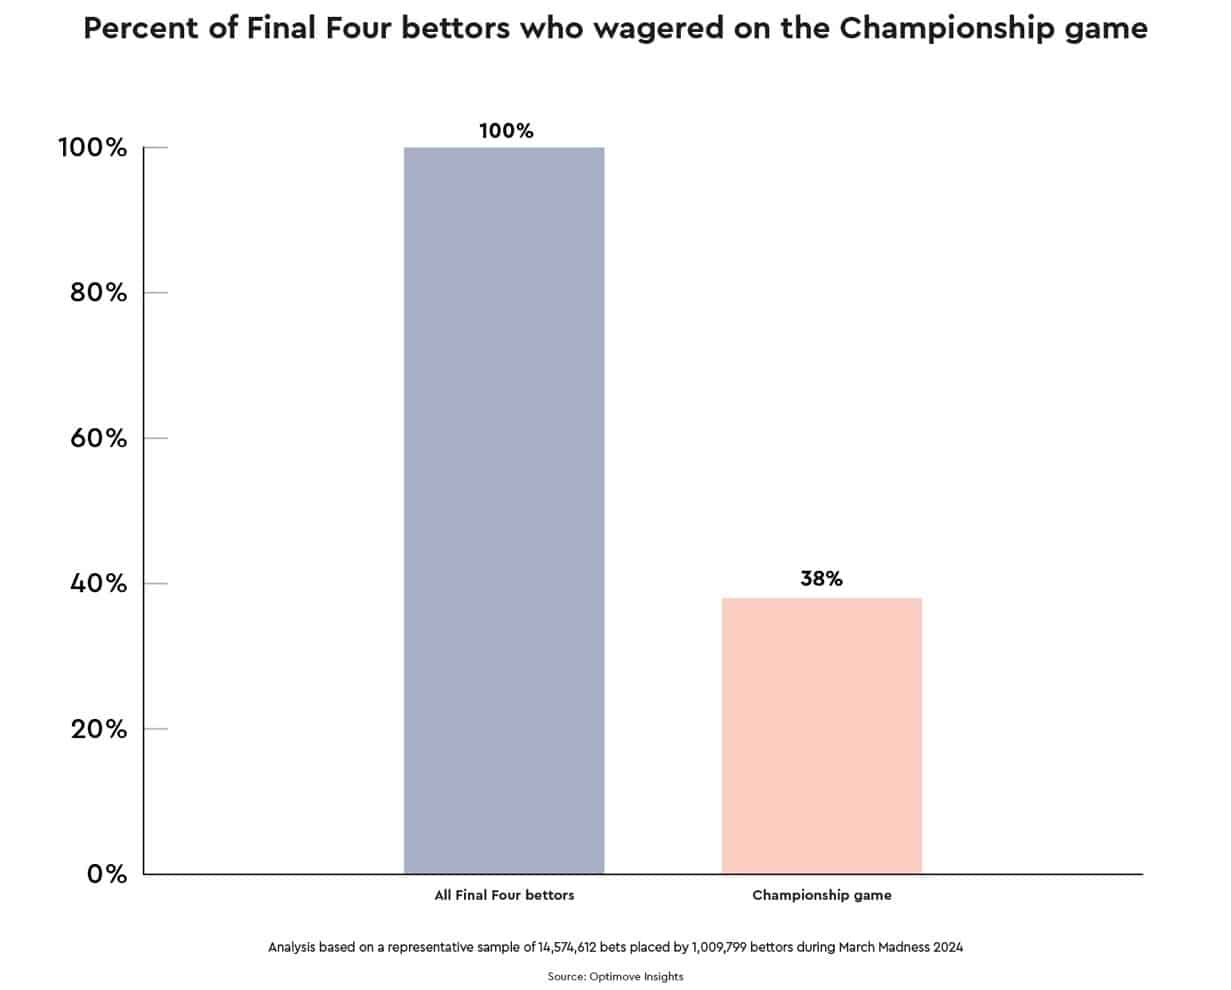
Among bettors who placed a wager during the Final Four:
38% also bet on the Championship Game
Implication: Bettors engaged during the Final Four are the most likely to continue into the Championship. This group shows the strongest retention between two consecutive stages of the tournament.
Key Recommendations for Sportsbooks
1. Focus on Non-Game Day Engagement
Bettors active during non-game days are more likely to continue betting in later rounds. Sportsbooks should:
Offer time-sensitive promotions during breaks
Highlight upcoming matchups and prop bet opportunities
Use CRM to trigger personalized engagement during lull periods
2. Address Emotional Drop-Off
As favorite teams are eliminated, bettors may disengage. To counter this:
Use messaging that encourages picking a new team or storyline
Offer alternative bet types not tied to team outcomes (e.g., over/unders, player props)
3. Segment by Entry Round
Each round of bettors behaves differently. Sportsbooks can:
Use segmentation to target bettors based on when they entered the tournament
Develop retention journeys specific to their engagement point
4. Prioritize Final Four Bettors
Final Four bettors have the highest carryover rate to the Championship Game.
Capitalize on this group with targeted messaging, countdown offers, and reminders
Encourage commitment to final-stage bets immediately following the Final Four
In Summary
Understanding betting behavior by round of entry provides a more accurate picture of how engagement evolves throughout the tournament. With targeted CRM and retention strategies built around these insights, sportsbooks can extend player activity beyond early rounds and maintain momentum through the Championship.
For more insights on player-betting behavior, contact us to request a demo.
Jonathan is a Marketing Data Analyst on the Professional Services team at Optimove. He specializes in uncovering actionable insights by analyzing customer data for retail and gaming clients. With a strong foundation in marketing analytics, he helps businesses optimize their strategies through data-driven decision-making. Jonathan holds a Bachelor of Science in Management, with concentrations in Marketing and Legal Studies.